After You Have Built Your Interface, Test Your ACORD Messages With the eiConsole for ACORD’s Built-in Message Testing Facility
In addition to building interfaces with the eiConsole for ACORD, the eiConsole can also be used to independently test these interfaces before they are deployed to an eiPlatform server environment. If you do not have an eiPlatform license, the tool provides an eiPlatform Emulator. The eiConsole includes 2 different modes for ACORD Message Testing.
(Note: PilotFish is the engine behind ACORD’s own TCF (Testing and Certification Facility). ACORD is also a licensee of the eiConsole. ACORD members should visit the ACORD website to find out details about a special license for the eiConsole for ACORD for members.)
First, the eiConsole offers a Testing Mode. This Testing Mode allows you to test individual components within a particular route.
In addition to the Testing Mode, the eiConsole for ACORD offers an eiPlatform Emulator. (The eiPlatform is the server environment that complements the eiConsole and allows you to run interfaces in an unattended mode. This mode can be simulated from within the eiConsole for ACORD using the eiPlatform Emulator.) The Emulator differs from the Testing Mode in that the Testing Mode only allows you to run one particular route at a time. The Emulator allows you to run all of the various routes at once that are configured using the eiConsole. That way, complex workflows composed of multiple interdependent transactions can be run end-to-end.
First, let’s take a look at how you would configure the Testing Mode within the eiConsole for ACORD.
After the developer has gone through and configured each of the stages of an interface they may choose to perform message testing for each stage or all of the stages.
In the testing mode, you can start a test at any point and end a test at any point in the flow of an interface.
![]()
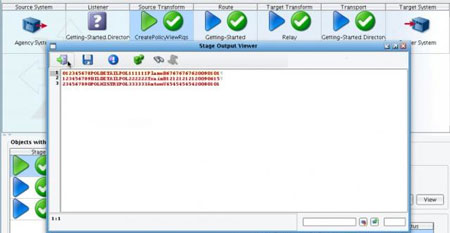
You can then also view the data as it passes through each of these stages.
For example, below we view the data at the Source Transform stage. A Stage Output window opens.

Next, let’s take a look at Message Testing using the eiPlatform emulator within the eiConsole for ACORD.
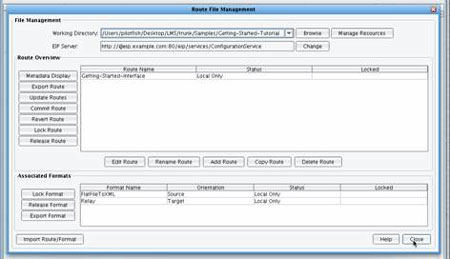
To run the EIP Emulator, make sure that you are in the appropriate Working Directory. Select any interface within that Working Directory.

Select the Route menu and choose Local EIP Emulator.

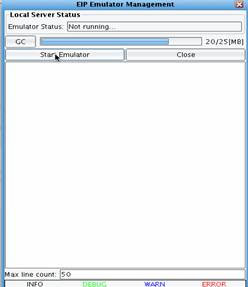
The EIP Emulator Management dialogue will appear. To start the Emulator, click the Start Emulator button.

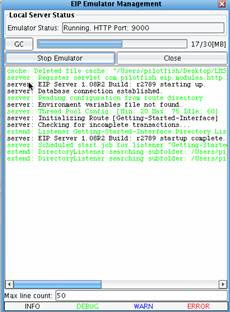
A log window will appear below the Local Server Status section. To test information flowing through the eiConsole for ACORD EIP Emulator, the Listener must be activated. In this particular case, the Listener uses a Directory Listener, so placing a file in the Directory will begin processing. The interface will behave exactly as it would in an unattended server environment. Activity can be monitored using the Log View. To stop the Emulator, you would simply click the Stop Emulator button. To close the window, simply choose the Close button.

The EIP Emulator also includes a GC button. This button stands for Garbage Collection. This convenient feature allows the Java Virtual Machine running the eiConsole for ACORD to clean up all unused memory.

Once the developer has completed their testing, they can return to the File Management window in the eiConsole for ACORD, select the interface that they wish to commit to a run-time environment, and then commit that route. Note: the Run-time deployment of interfaces requires the eiPlatform, licensed separately from PilotFish.
To learn more about using the eiConsole for ACORD for Message Testing click on the links below or Contact Us for a custom demonstration.
eiConsole for ACORD – Testing Mode Video Demo
eiConsole for ACORD – EIP Emulator Video Demo
If you’re curious about the software features, free trial, or even a demo – we’re ready to answer any and all questions. Please call us at 860 632 9900 or click the button.

